Explain the concept of scarcity, choice and opportunity cost with the help of Production possibility curve.
Concept of Scarcity : In economics, we always refers to scarcity of resources available to us for the satisfaction of our wants. Human wants are endless where as resources are scarce. This is true of all kinds of economies rich and poor developed and underdeveloped. Scarcity is a situation in which resources available for the satisfaction of wants are less than the resources required for the satisfaction of human wants. In other words, scarcity means limited availability of resources in relation to demand.
Scarcity is the root cause of economic problem : Scarcity is a relative concept. It is always studied with reference to human unlimited wants with the means or the resources are limited. Definitely, resources are scarce. But all resources are not equally scarce all the time. Scarcity causes price. Greater the scarcity of a time, higher in its market price.
Concept of choice : Scarcity is a problem not simply because resources are scarce in relation to human wants. It is also because resources have alter native uses. Because resources are scarcise and have alternative use, we must confront the problem of choice. We must exercise choice among different options available to us. To illustrate, if there are two options for the use of land viz.
- Production of wheat, and
- Production of rice, we must exercise our choice whether to produce wheat or rice or how much of rice and how much of wheat.
In fact, it is related to the problem of allocation of resources to different use.
Problem of choice is also called the problem of allocation of resources to alternative use : Unlimited wants and limited resources give rise to economic problem. The problem is essentially of making a choice. We find that a country (or a household) is always confronted with the problem of making adjustments between limited means with alternative uses and unlimited wants having different priorities. This gives rise to the problem of choice
which in turn is the crux of the economic problem.
Concept of opportunity cost: Opportunity cost is the benefit that is foregone to avail the benefit of another opportunity. It is the cost of choosing one opportunity in terms of the loss on next best.
Illustration: Using a given piece of land (and other inputs). We may the following opportunities (or possibilities) of production:
- Opportunity 1: 10 ton of rice (worth 20,000)
- Opportunity 2 : 12 ton of wheat (worth 24,000)
- Opportunity 3 : 25 ton of sugarcane (worth 30,000)
Being a rational producer (aiming at maximization of profit), we will chose opportunity 3, using land (and other input) of the production of sugarcane worth 30,000. Choice of opportunity 3 causes, loss of opportunities 1 and 2. So obvious, because with the given resources any one opportunity can be availed, not more. Opportunity 2 (offering 12 ton of wheat worth 24,000) is the 2nd best, also called next best opportunity. Comparing opportunity 3rd with opportunity 2 we find that loss of 12 ton wheat (worth 24,000) is the maximum loss that we one suffering when we are choosing opportunity 3 (which happens to be the best opportunity, This maximum loss of 12 ton wheat (worth 24,000) is the opportunity cost of using land for the production of sugarcane.
Opportunity cost is the cost of choosing best opportunity (of resources utilization) in terms of the loss of value (or the loss of output) if the given resources were utilized in the next best (or second best) opportunity.
Production Possibility Curve (PP Curve) solves the problem of allocation of resources in an economy: Due to scarcity of resources, an economy has to decide what commodities have to be produced and in what quantities. For example, the economy must decide what proportion of its resources should go into the production of civilian goods and what proportion into the production of goods needed for defense.
The problem of ‘Wheat to produce i.e. allocation of resources is represented along the Production Possibility Curve (PP Curve). The different points on PP Curve represent different possibilities of allocation of resources.
In figure, PP is the Production Possibility Curve. It shows alternative combination of a, a1, a2 of wheat and machines. The different combinations goods (wheat and machine) which and economy can produce reveal two basic facts.
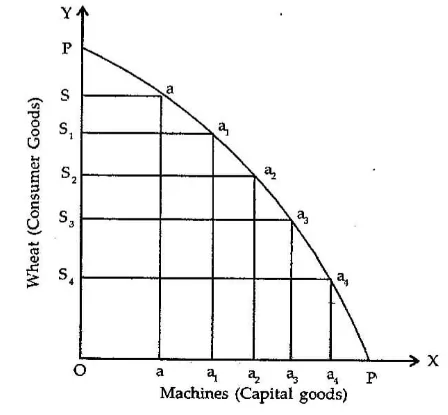
- More production of machines is possible only when less of wheat is produced. So, that resources are to be withdrawn from the production of wheat for greater production of machines.
- Every time when we plan to produce more of machines, production of wheat is to be sacrificed at the increasing rate (S3 S4 > S2 S3 > S1 S2 > SS1).
So that, there is increasing marginal rate of transformation between the production of Wheat and machines. It also means that the opportunity cost of producing machines (in terms of the loss of production of wheat) tends to rise as more of machines are produced.