Using Indifference curve technique, explain the income effect and the substitution effect of a decrease in price of a normal commodity.
Price Effect: Separation of Income and Substitution Effects : A change in the price of a commodity, say X, other things remaining the same, causes a change in the demand for X. This change in demand is called Price Effect (PE). Price effect is split into two components:
- Income Effect (IE), and
- Substitution Effect (SE).
Income Effect: Income effect states that a change in the price of good will bring about a change in the real income (purchasing power) of the consumer, which in turn brings about a change in the quantity demanded of the goods. If price of good X falls then consumer’s real income rises and he will consume more of X if it is a normal good. On the other hand, with increase in real income, he will consume less of X if it an inferior or Giffer good because he would like to buy better commodities with increased purchasing power. The income effect operates on the assumption that relative price of goods remains constant.
Substitution Effect : It arise due to change in the relative price. When price of one commodity decreases (or increases), it becomes relatively cheaper (or costlier) than the other. The consumers have an inherent tendency to substitute cheaper goods for relatively costlier ones. This is called Substitution Effect. Substitution effect is always negative. It follows the law of demand. The substitution effect operates on the assumption that real income of the consumer is unchanged. The implication of this assumption are crucial in plotting the SE, i.e.
- Real income unchanged implies consumer satisfaction level is unchanged. He remains on the same indifference curve as before the price change.
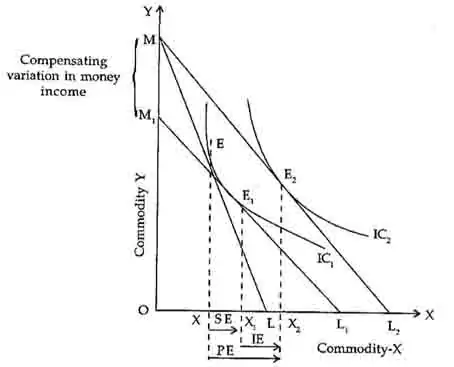
- Real income is calculated as (money income / price of the goods) If price of the good falls, then for the whole ratio to remain constant by assumption, money income must fall. Such a fall in money income is known as compensating variation in income (if price price rises, money income will rise). Figure, graphically illustrates the splitting of price effect into income and substitution effects.
Where
Point E → ML in the initial budget line which is tangent to indifference curve IC1. Point E is the point of consumer’s equilibrium. The consumer buys OX units of commodity X at a price given by the slope of ML budget line.
Point E, → Suppose price of commodity X falls. Then budget line ML shift to ML2. The slope of ML2 measures the new lower price of commodity X. The consumer is in equilibrium at point E2 on higher IC2. He consumes OX2 unit of X.
XX2 →It is the extent of price effect. Due to fall in price of commodity X, consumer buyers XX2 More of commodity X. This price effect (PE) is then split into substitution effect (SE) and income effect (IE).
XX1 → It is the substitution effect the SE is seen graphically when a line is drawn parallel to the new budget line (ML2) and tangent to the original indifference curve (IC1). The line M1L1 which is tangent to IC1 at point E1 has been so constructed. The quantity of X commodity associated with point E1 i.e., OX1 is the quantity of X commodity, that would be consumed after the price fall. Hence, XX1 is the substitution effect.
X1X2 → It is the income effect. It is shown by the movement from E1 to E2 . If the MM1, amount of income (that is the compensating variation in income) is given back to the consumer, he will shift to higher indifference curve IC2 and Will be in equilibrium at E2. Hence, X1X2 is the quantity by which consumption of commodity X increases as a result of the increase in purchasing power associated with a fall. in the price of commodity X. The income effect is X1 X2.